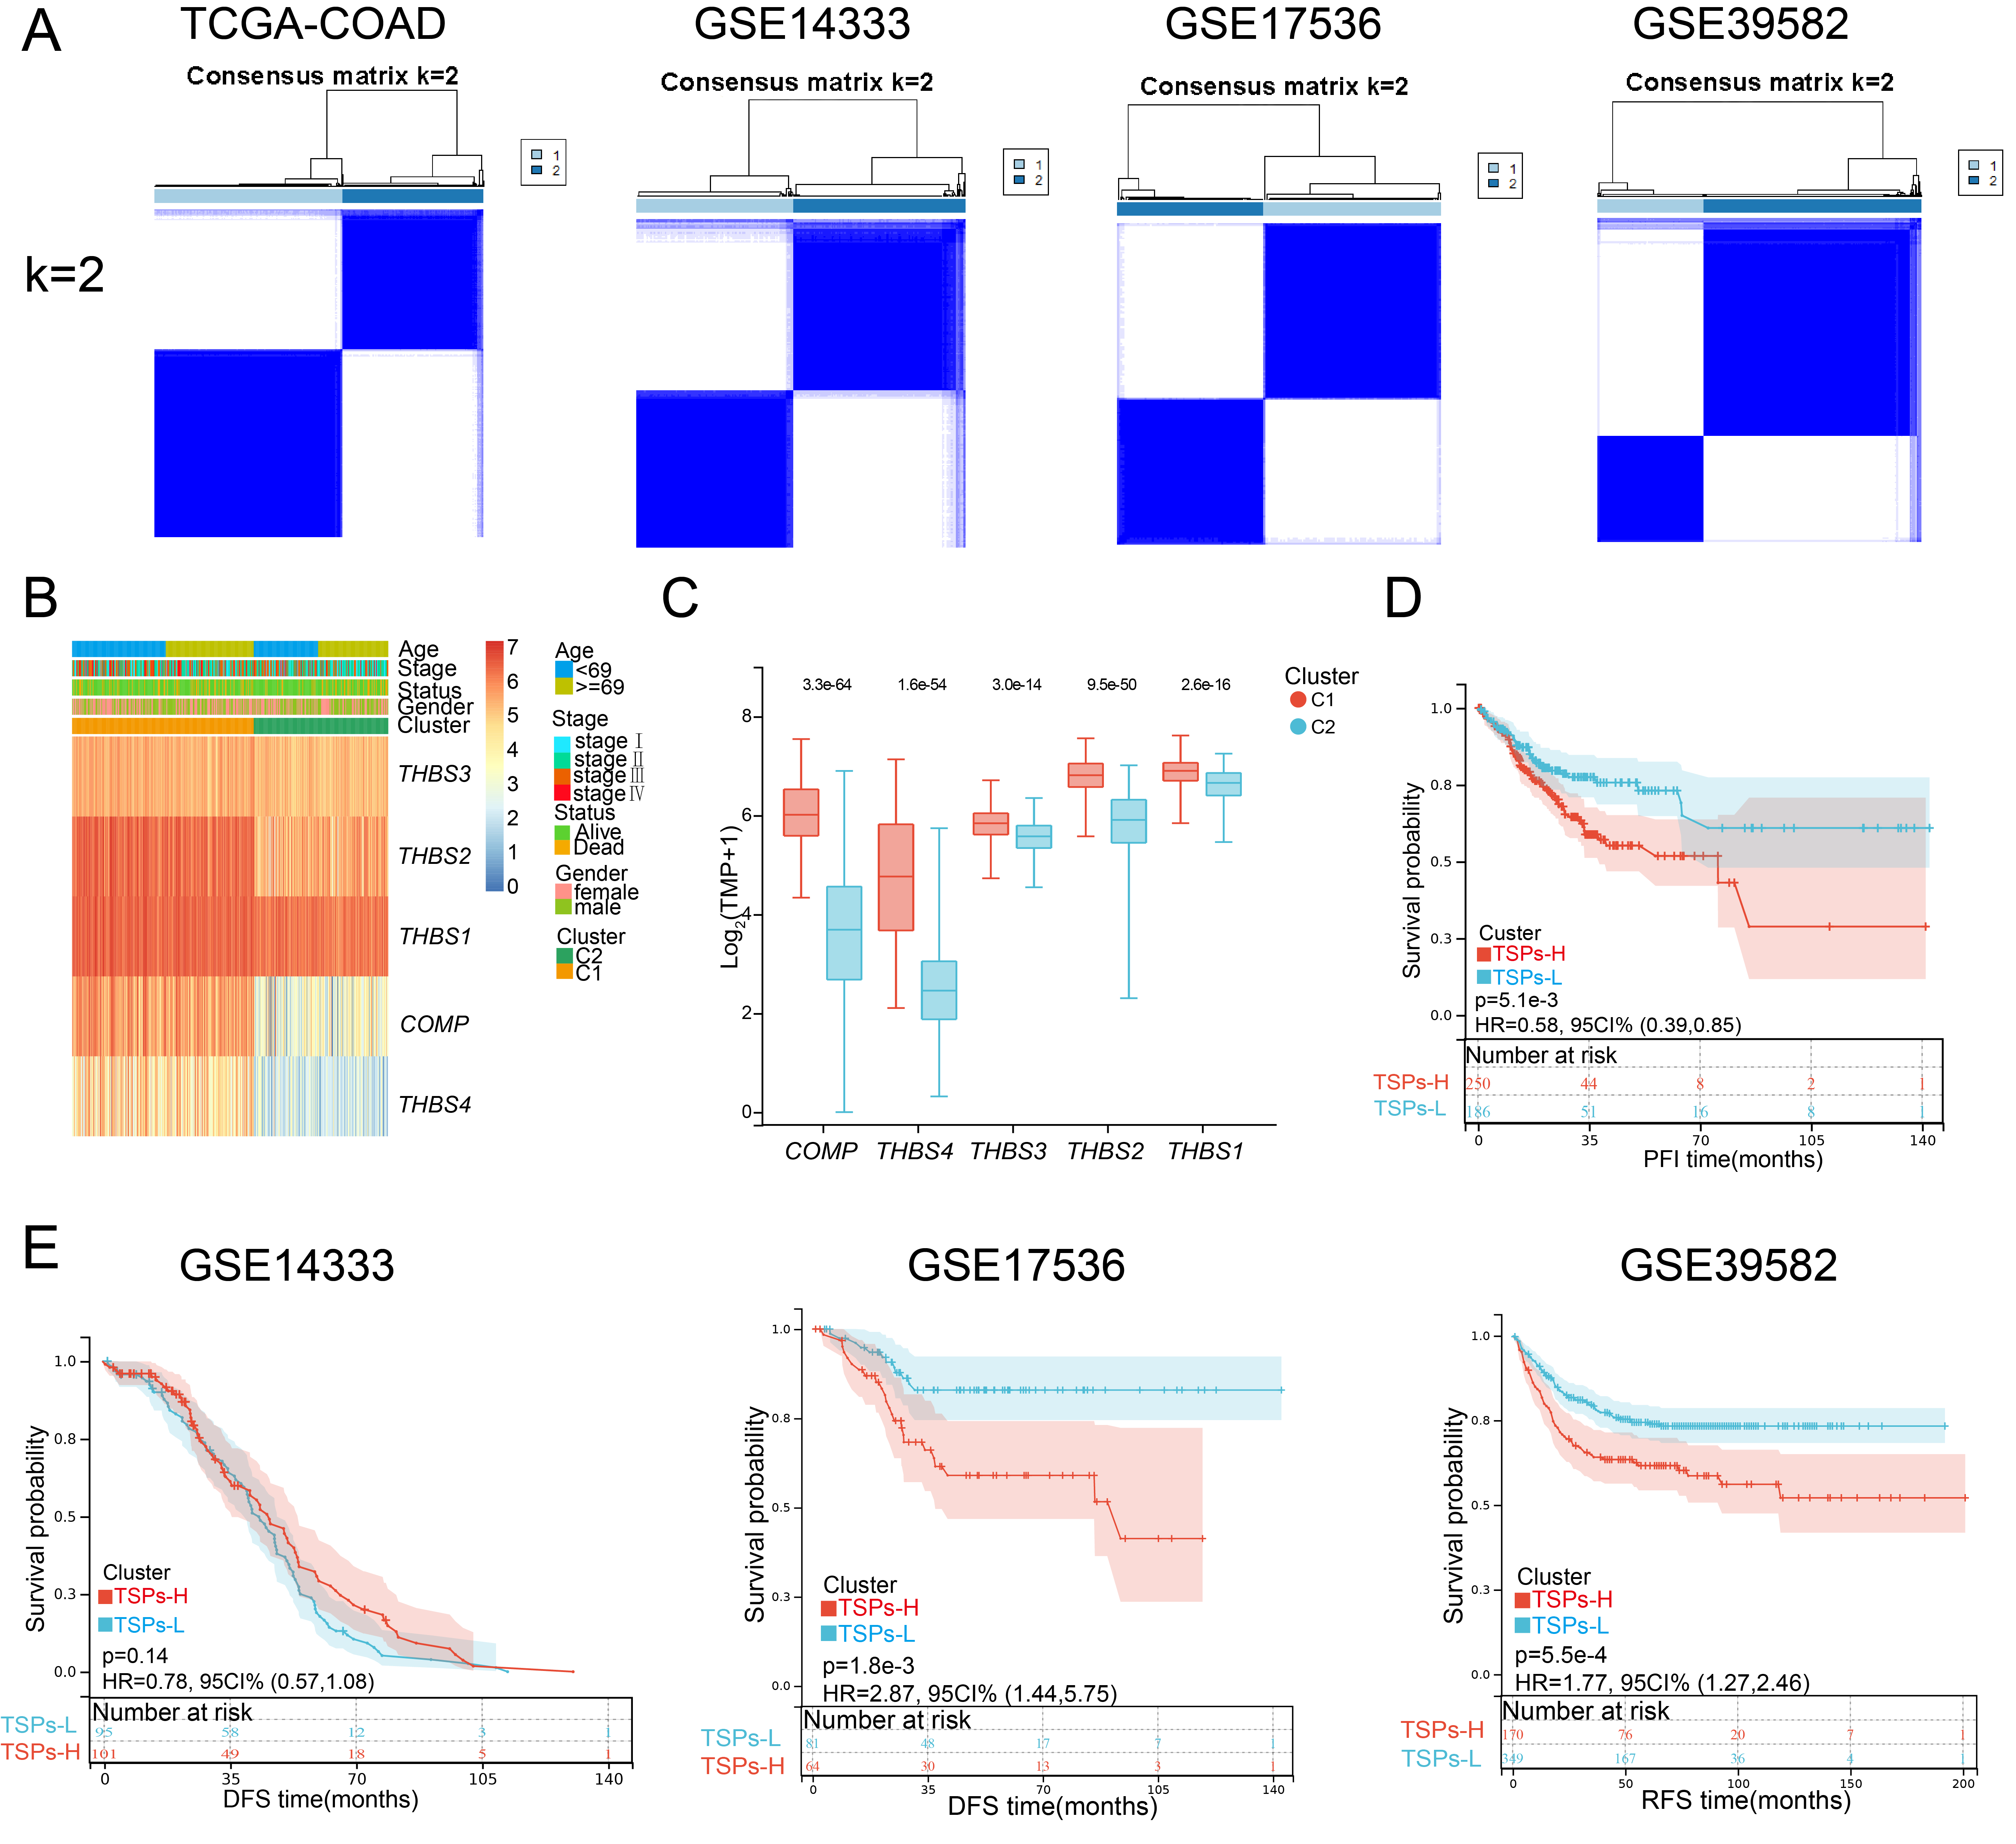
Fig. 3 Classification of clusters and their differences based on the levels of TSPs expression.
(A) Clusters of patients classified using multiple cohorts, including TCGA-COAD (n=455) and three GEO datasets (GSE14333, GSE17536, and GSE39582) (n=251, n=177, and n=566, respectively), with a consensus matrix K=2. (B) Clinical phenotype difference between clusters in the TCGA-COAD cohort. (C) Significant expression difference of TSPs between two clusters in the TCGA-COAD cohort by Wilcoxon rank-sum test. (D) PFI survival difference between clusters in the TCGA-COAD cohort. (E) Survival difference between clusters in three independent cohorts (GSE14333, GSE17536, and GSE39582).
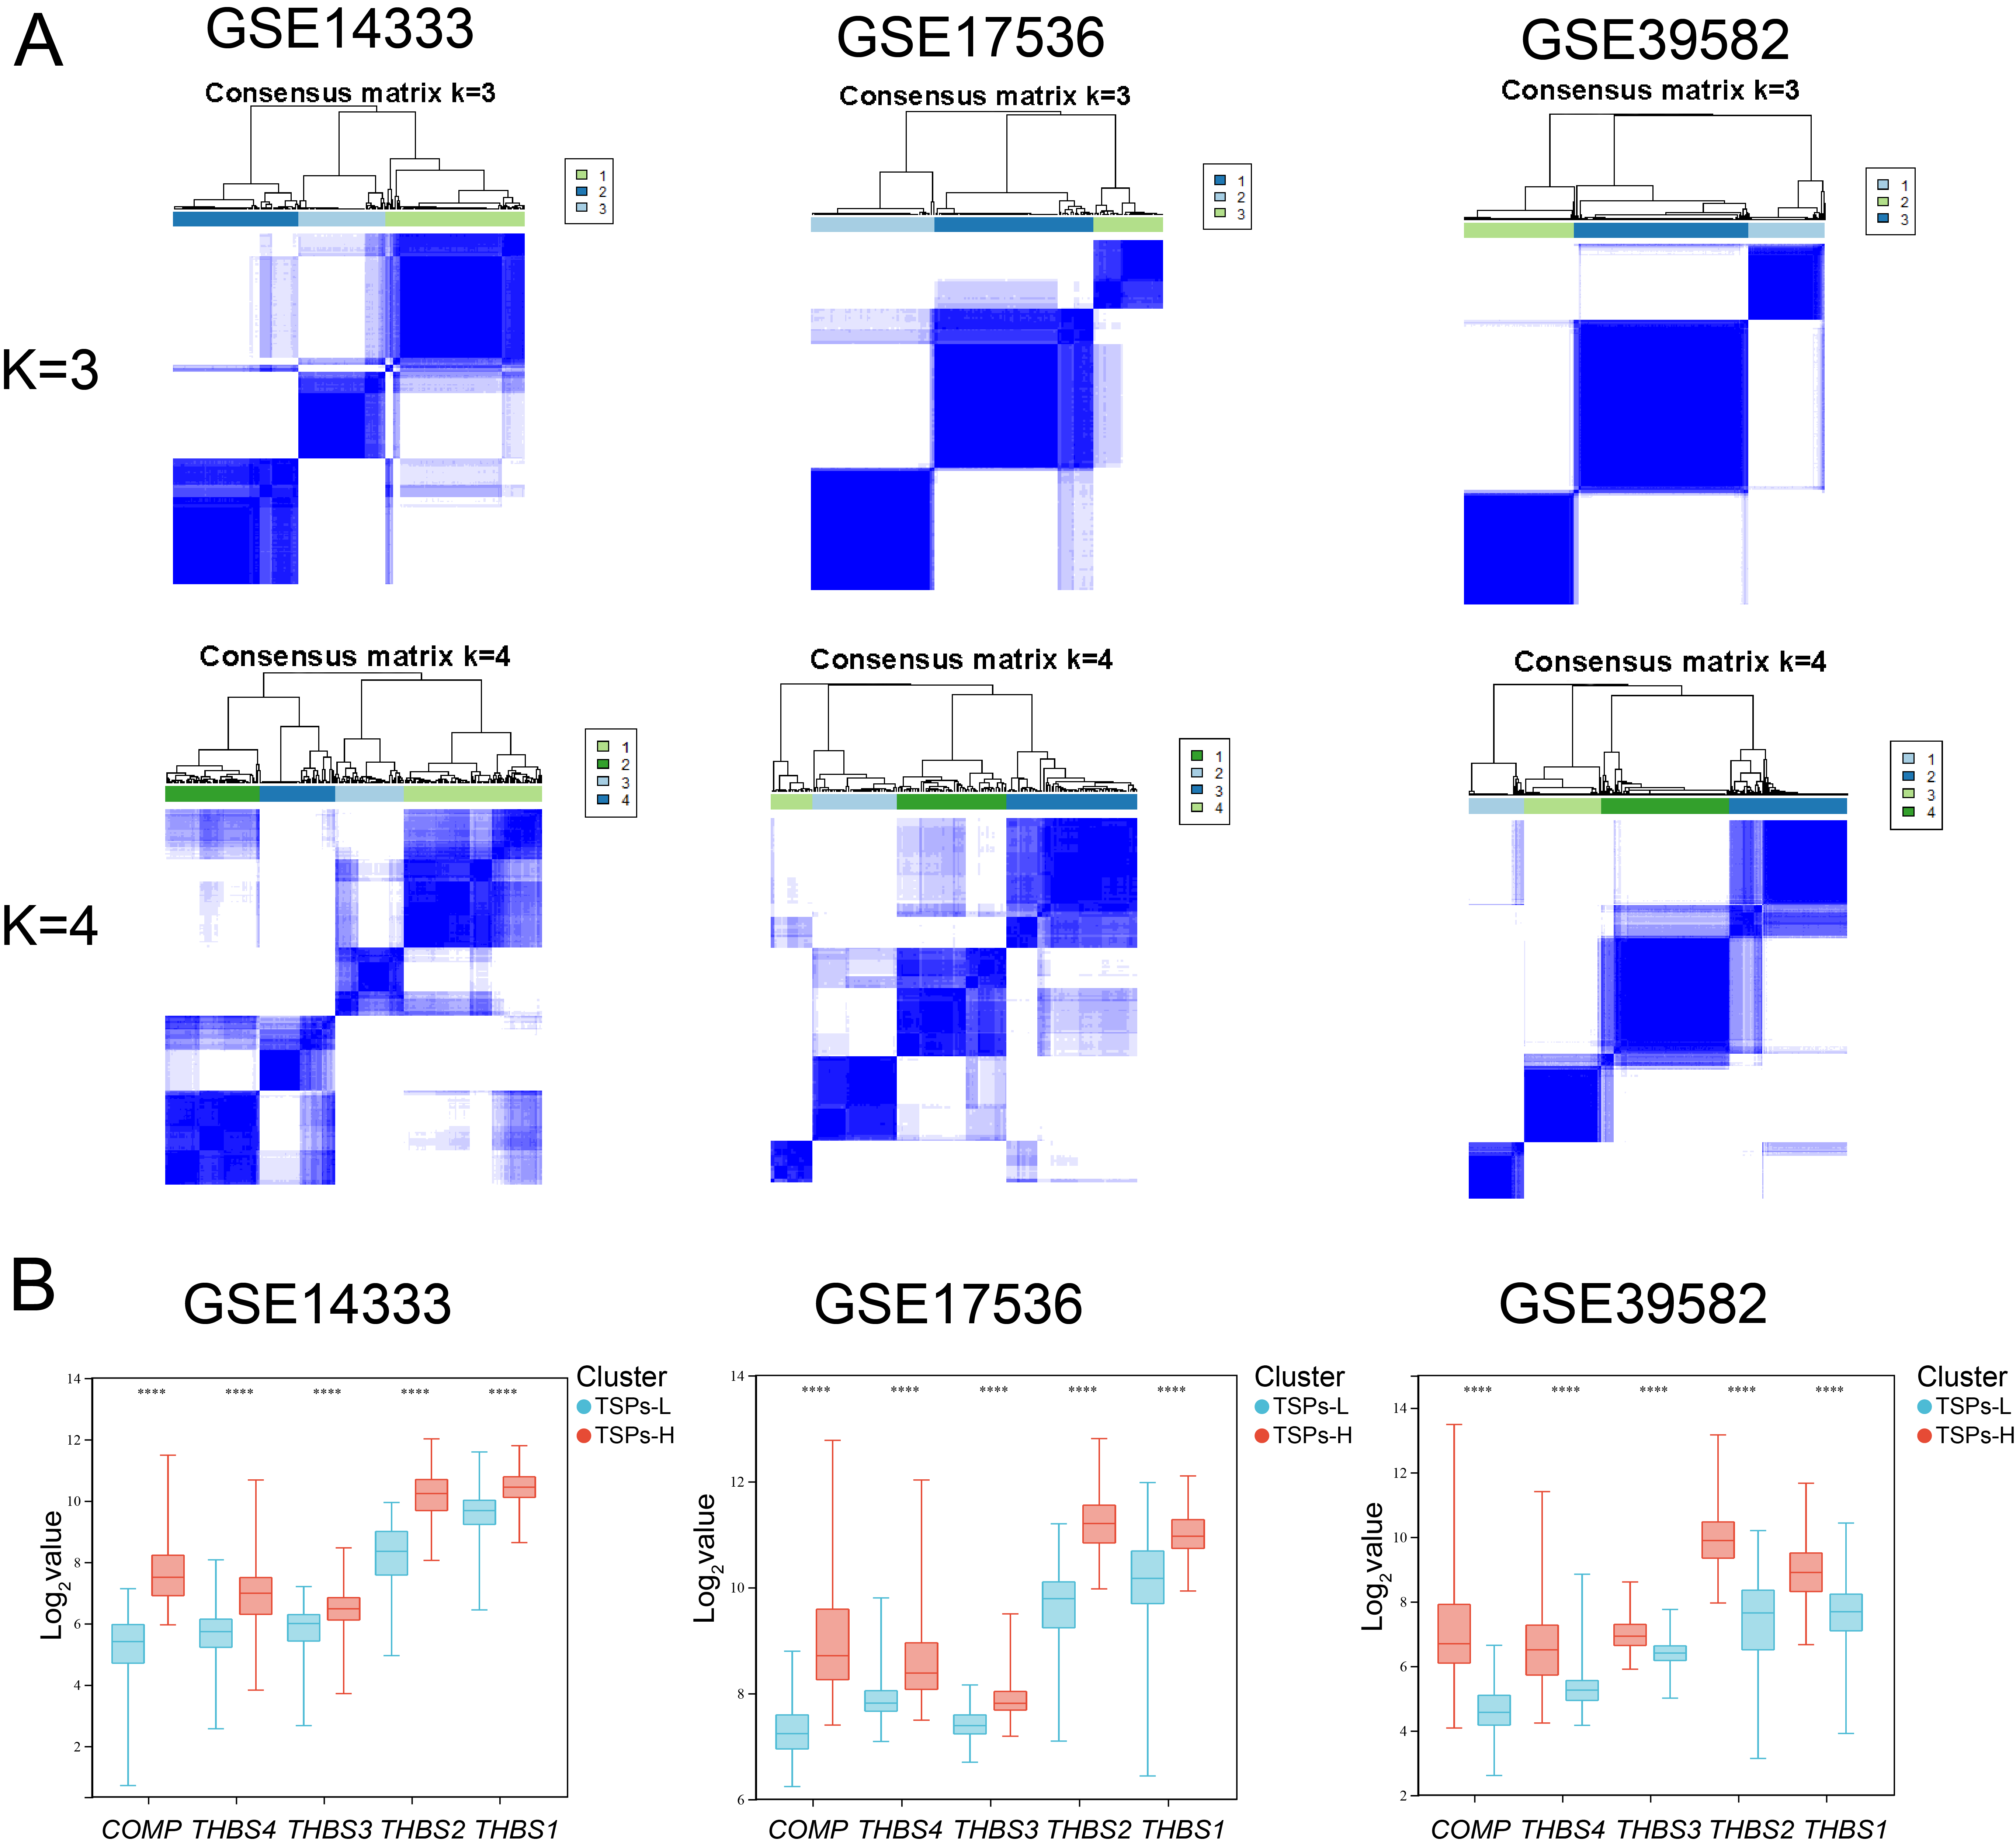
Fig.S3 Stratification of patients with colon cancer based on the levels of TSPs expression.
(A) Clusters classified using multiple cohorts, including three GEO datasets (GSE14333, GSE17536 and GSE39582) (n =251, n =177 and n = 566, respectively), with a consensus matrix K = 3 and 4. (B) Significant differential expression of TSPs between TSPs-H and TSPs-L clusters in three independent cohorts (GSE14333, GSE17536, and GSE39582) characterized by Box plot.