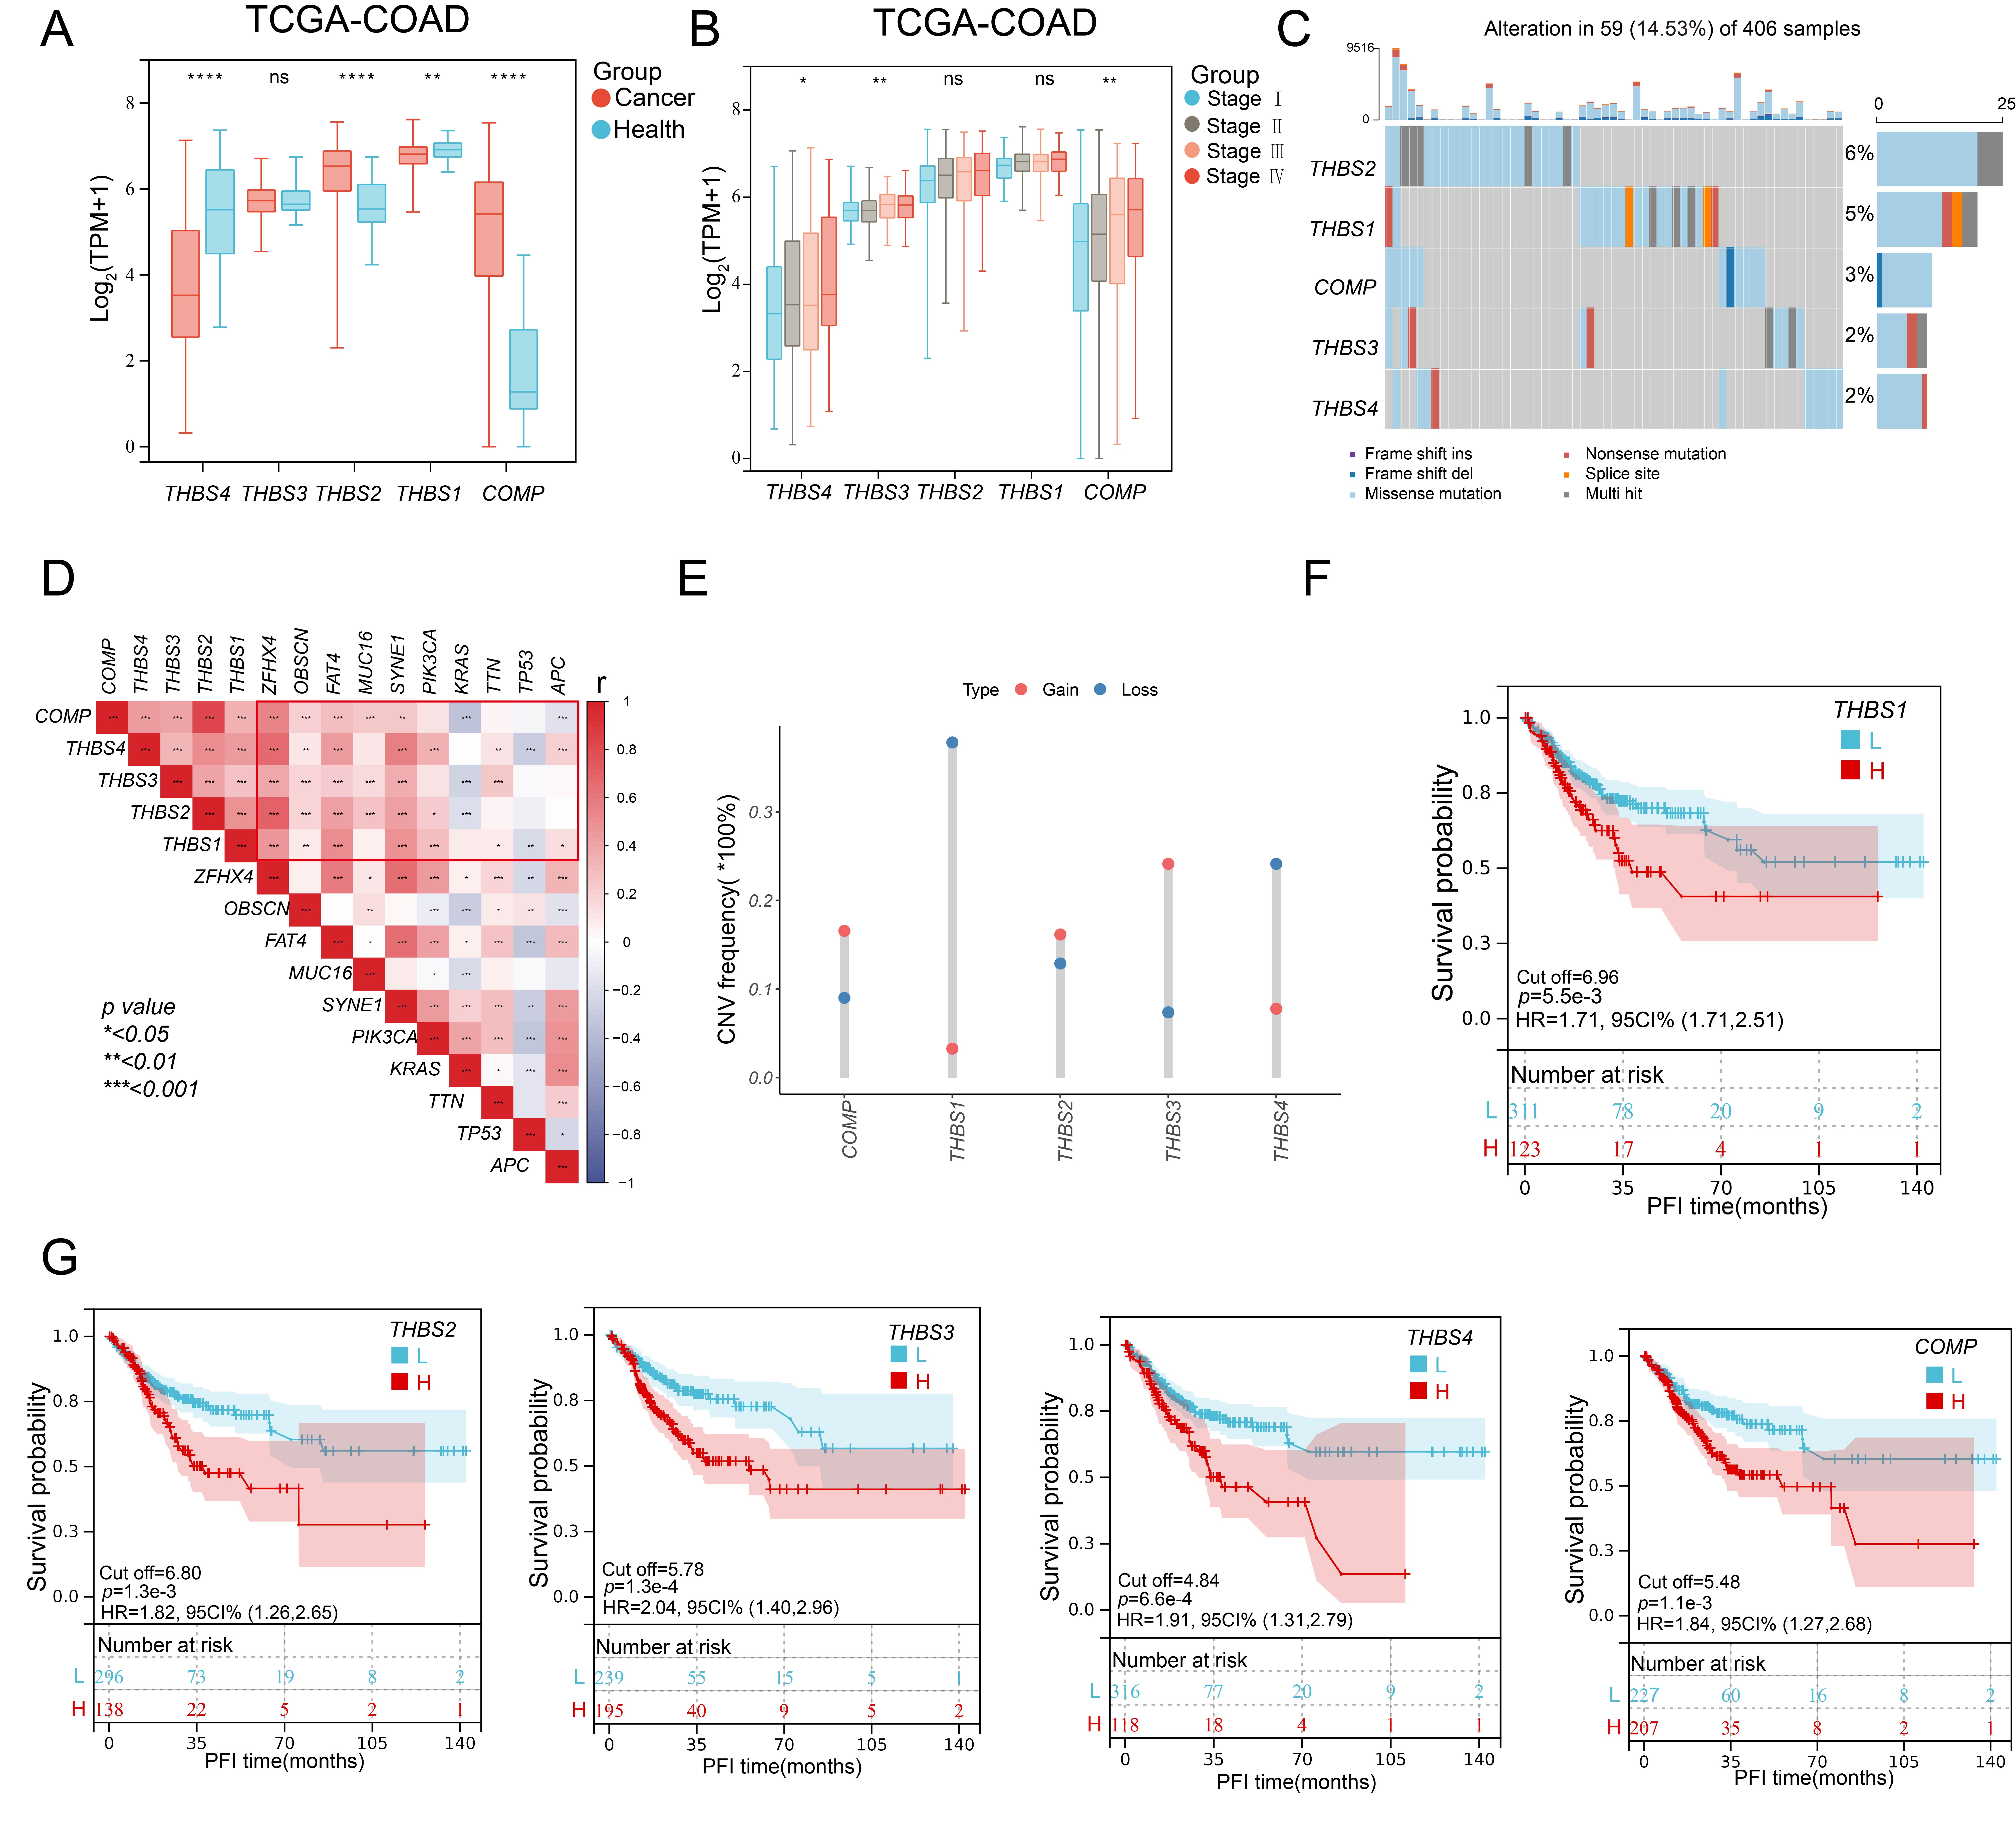
Fig.1 Heterogeneity of TSPs expression and prognostic value in colon cancer.
(A) Gene differential expression of TSPs (Thrombospondins) between tumor and normal tissues assessed using the Wilcoxon test (*, p < 0.05; **, p < 0.01; ***, p < 0.001; ****, p < 0.0001) in the TCGA-COAD cohort. (B) Gene differential expression of TSPs in different tumor stages within the TCGA-COAD cohort. (C) Mutations in TSPs observed in the TCGA-COAD cohort analyzed with maftools. (D) Co-expression patterns of TSPs with the top 10 mutated genes in the TCGA-COAD cohort. Correlation coefficients are visualized with box colors. (E) Copy number variation (CNV) frequency of TSPs in the TCGA-COAD cohort. (F & G) Kaplan-Meier survival plot illustrating the impact of TSPs expression on the survival probability of colon cancer patients in the TCGA-COAD cohort.

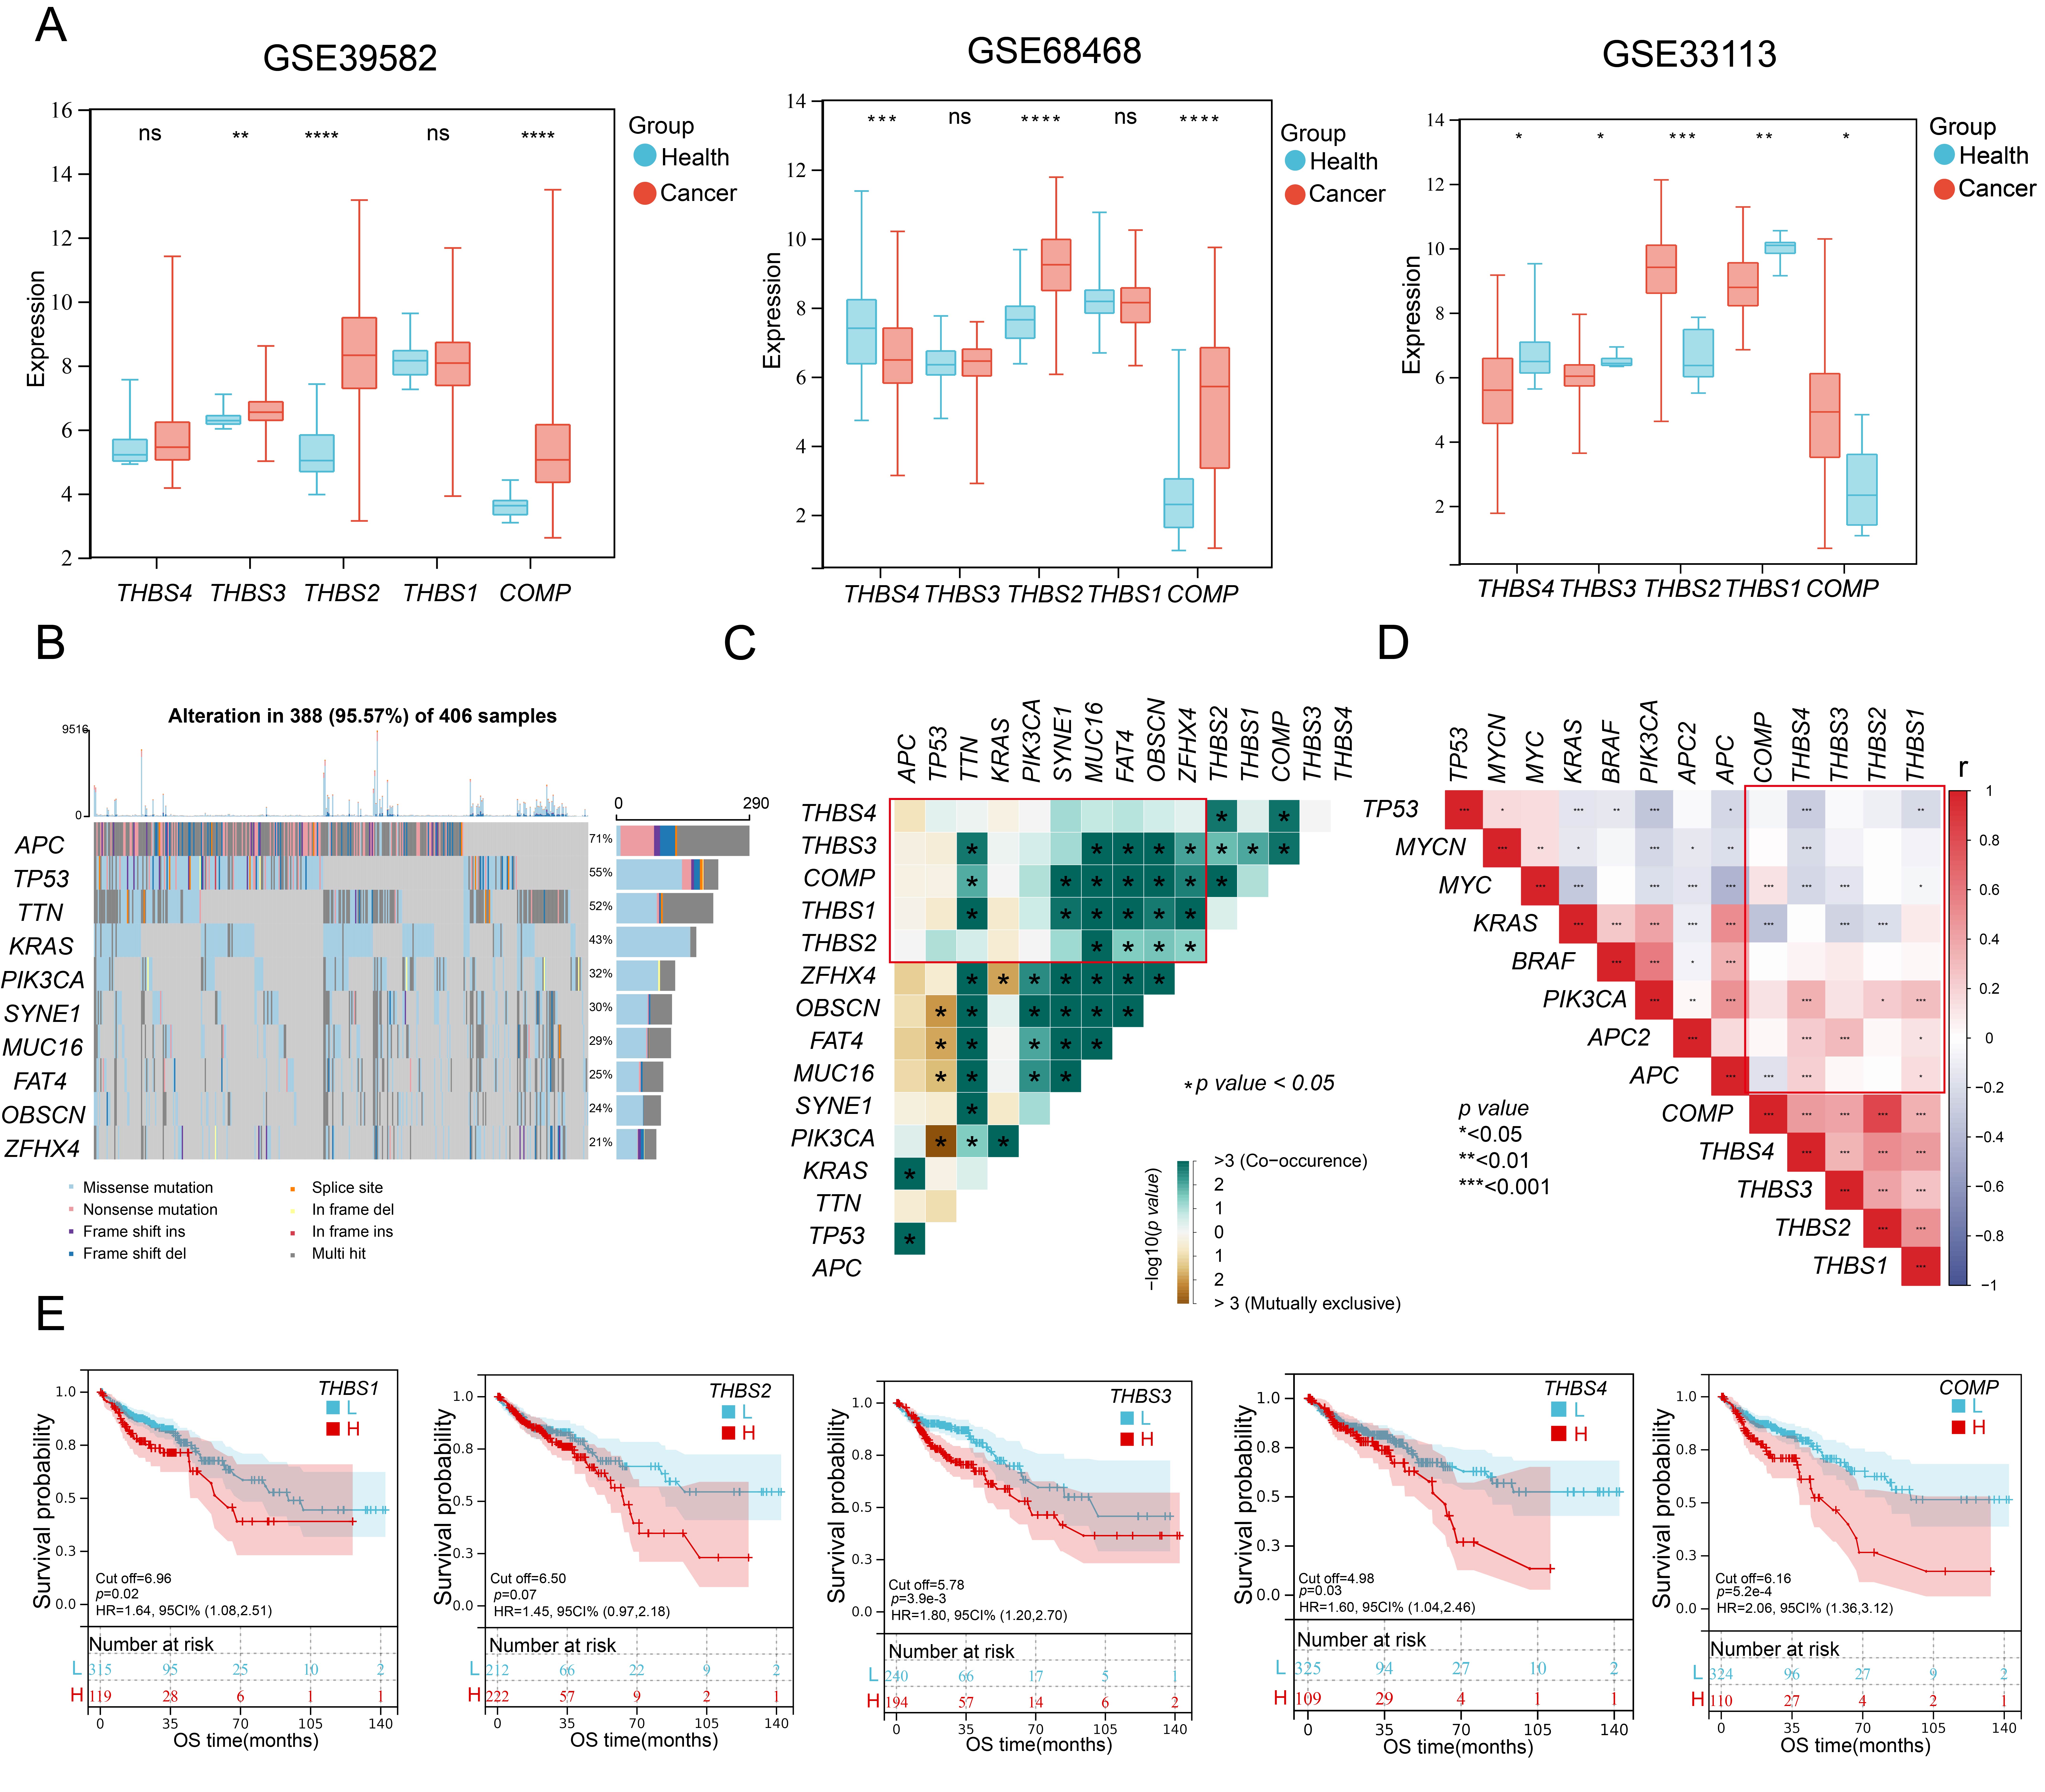
Fig.S1 Heterogeneity of TSPs expression in colon cancer and prognostic value.
(A) Gene differential expression of TSPs (Thrombospondins) between tumor and normal tissues assessed with the Wilcoxon test (*, p < 0.05; **, p < 0.01; ***, p < 0.001; ****, p < 0.0001) in three GEO cohorts(GSE39582, GSE68468, and GSE33113). (B) The top 10 mutated genes in colon cancer identified by maftools in the TCGA-COAD cohort. (C) Co-mutations between TSPs and the top 10 mutated genes in colon cancer. (D) Co-expression patterns of TSPs among samples with common proto-oncogenes and oncogenes. (E) Kaplan-Meier plot illustrating the overall survival probability of colon cancer patients based on TSPs expression levels in the TCGA-COAD cohort.
