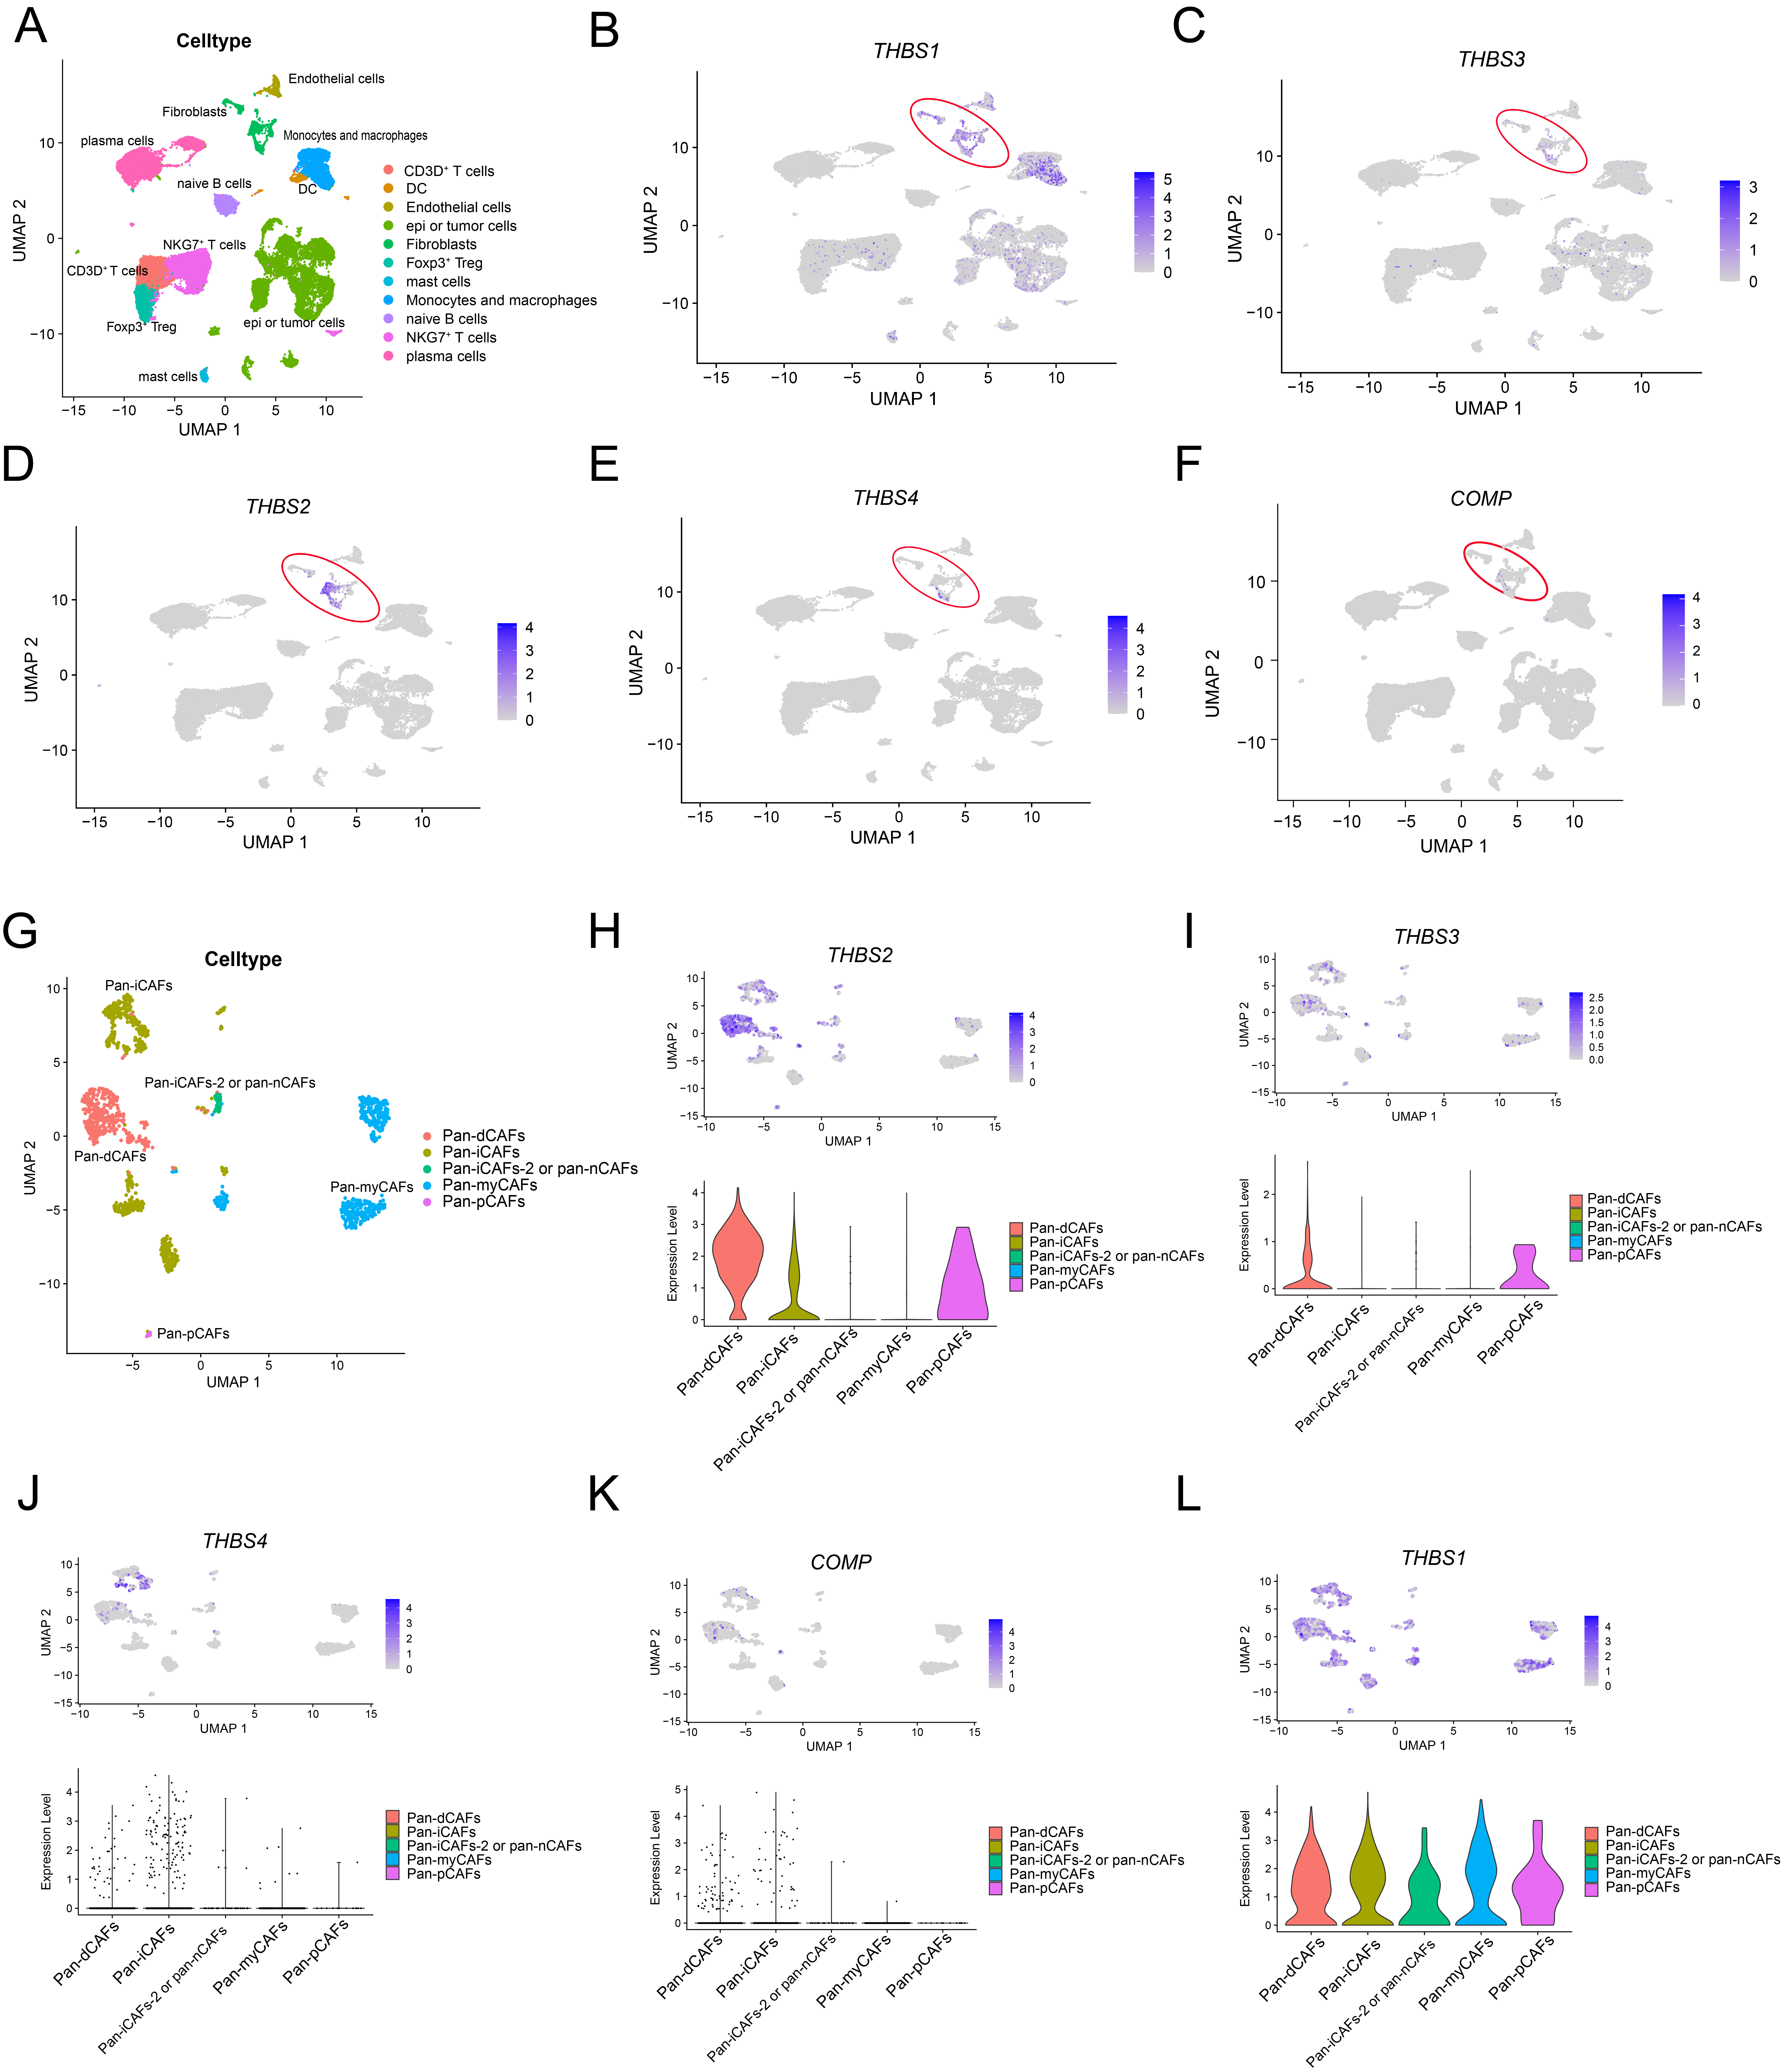
Fig. 5 Cellular Origin of TSPs in Colon Cancer Tissues Revealed by Single-Cell Analysis
(A) Identification of major cell types in the colon cancer microenvironment using the dataset of GSE166555 (n =12). (B-F)Differential expression of TSPs across various cell types (using GSE16655). Each dot represents an individual cell. (G) Characterization of major CAFs subtypes in the colon cancer microenvironment from the GSE166555 cohort. (H & L) Differential expression of TSPs in the distinct CAFs subtypes (GSE16655) illustrated by UMAP and violin plots. Each dot represents an individual cell.
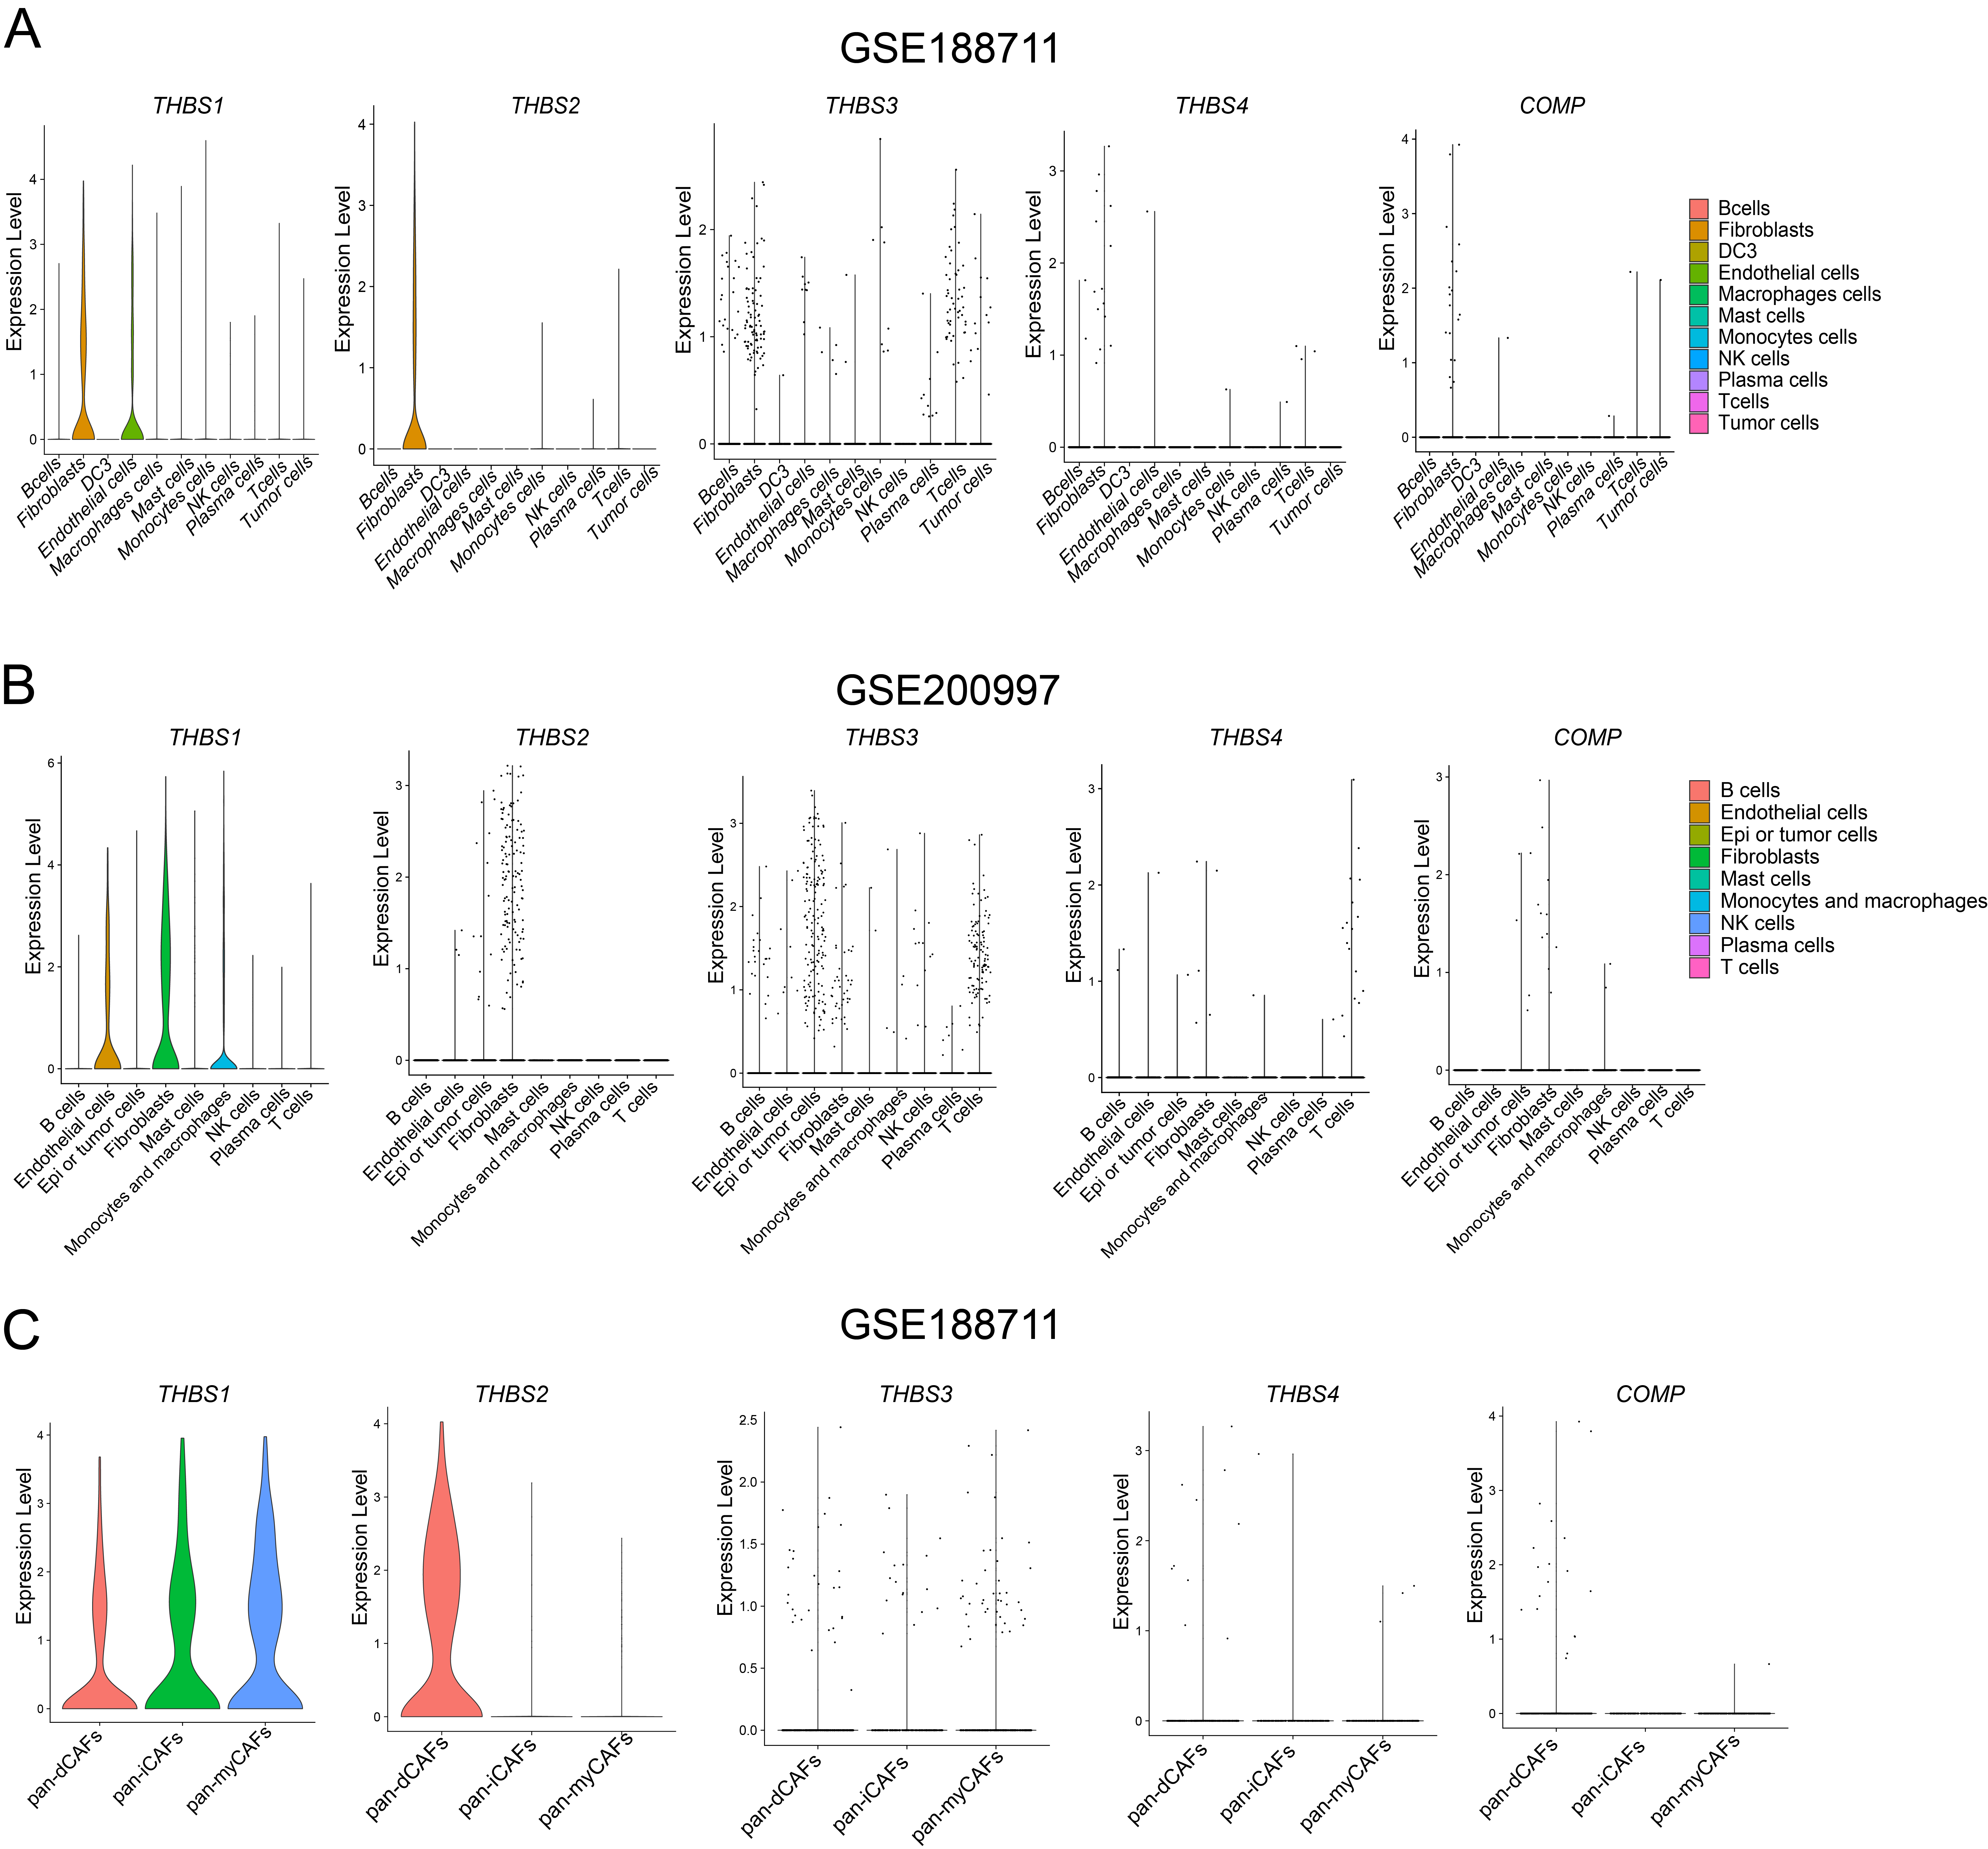
Fig. S5: Cellular Origin of TSPs in the Colon Cancer by Single-Cell Analysis.
(A) Expression patterns of TSPs by violin plot in the cohort (188711, n=6). (B) Differential expression of TSPs among various cell types in the cohort (GSE20097, n=16),with each dot representing a cell. (C) Expression of TSPs in CAFs subtypes based on the cohort (GSE188711, n=6) using violin plot.

