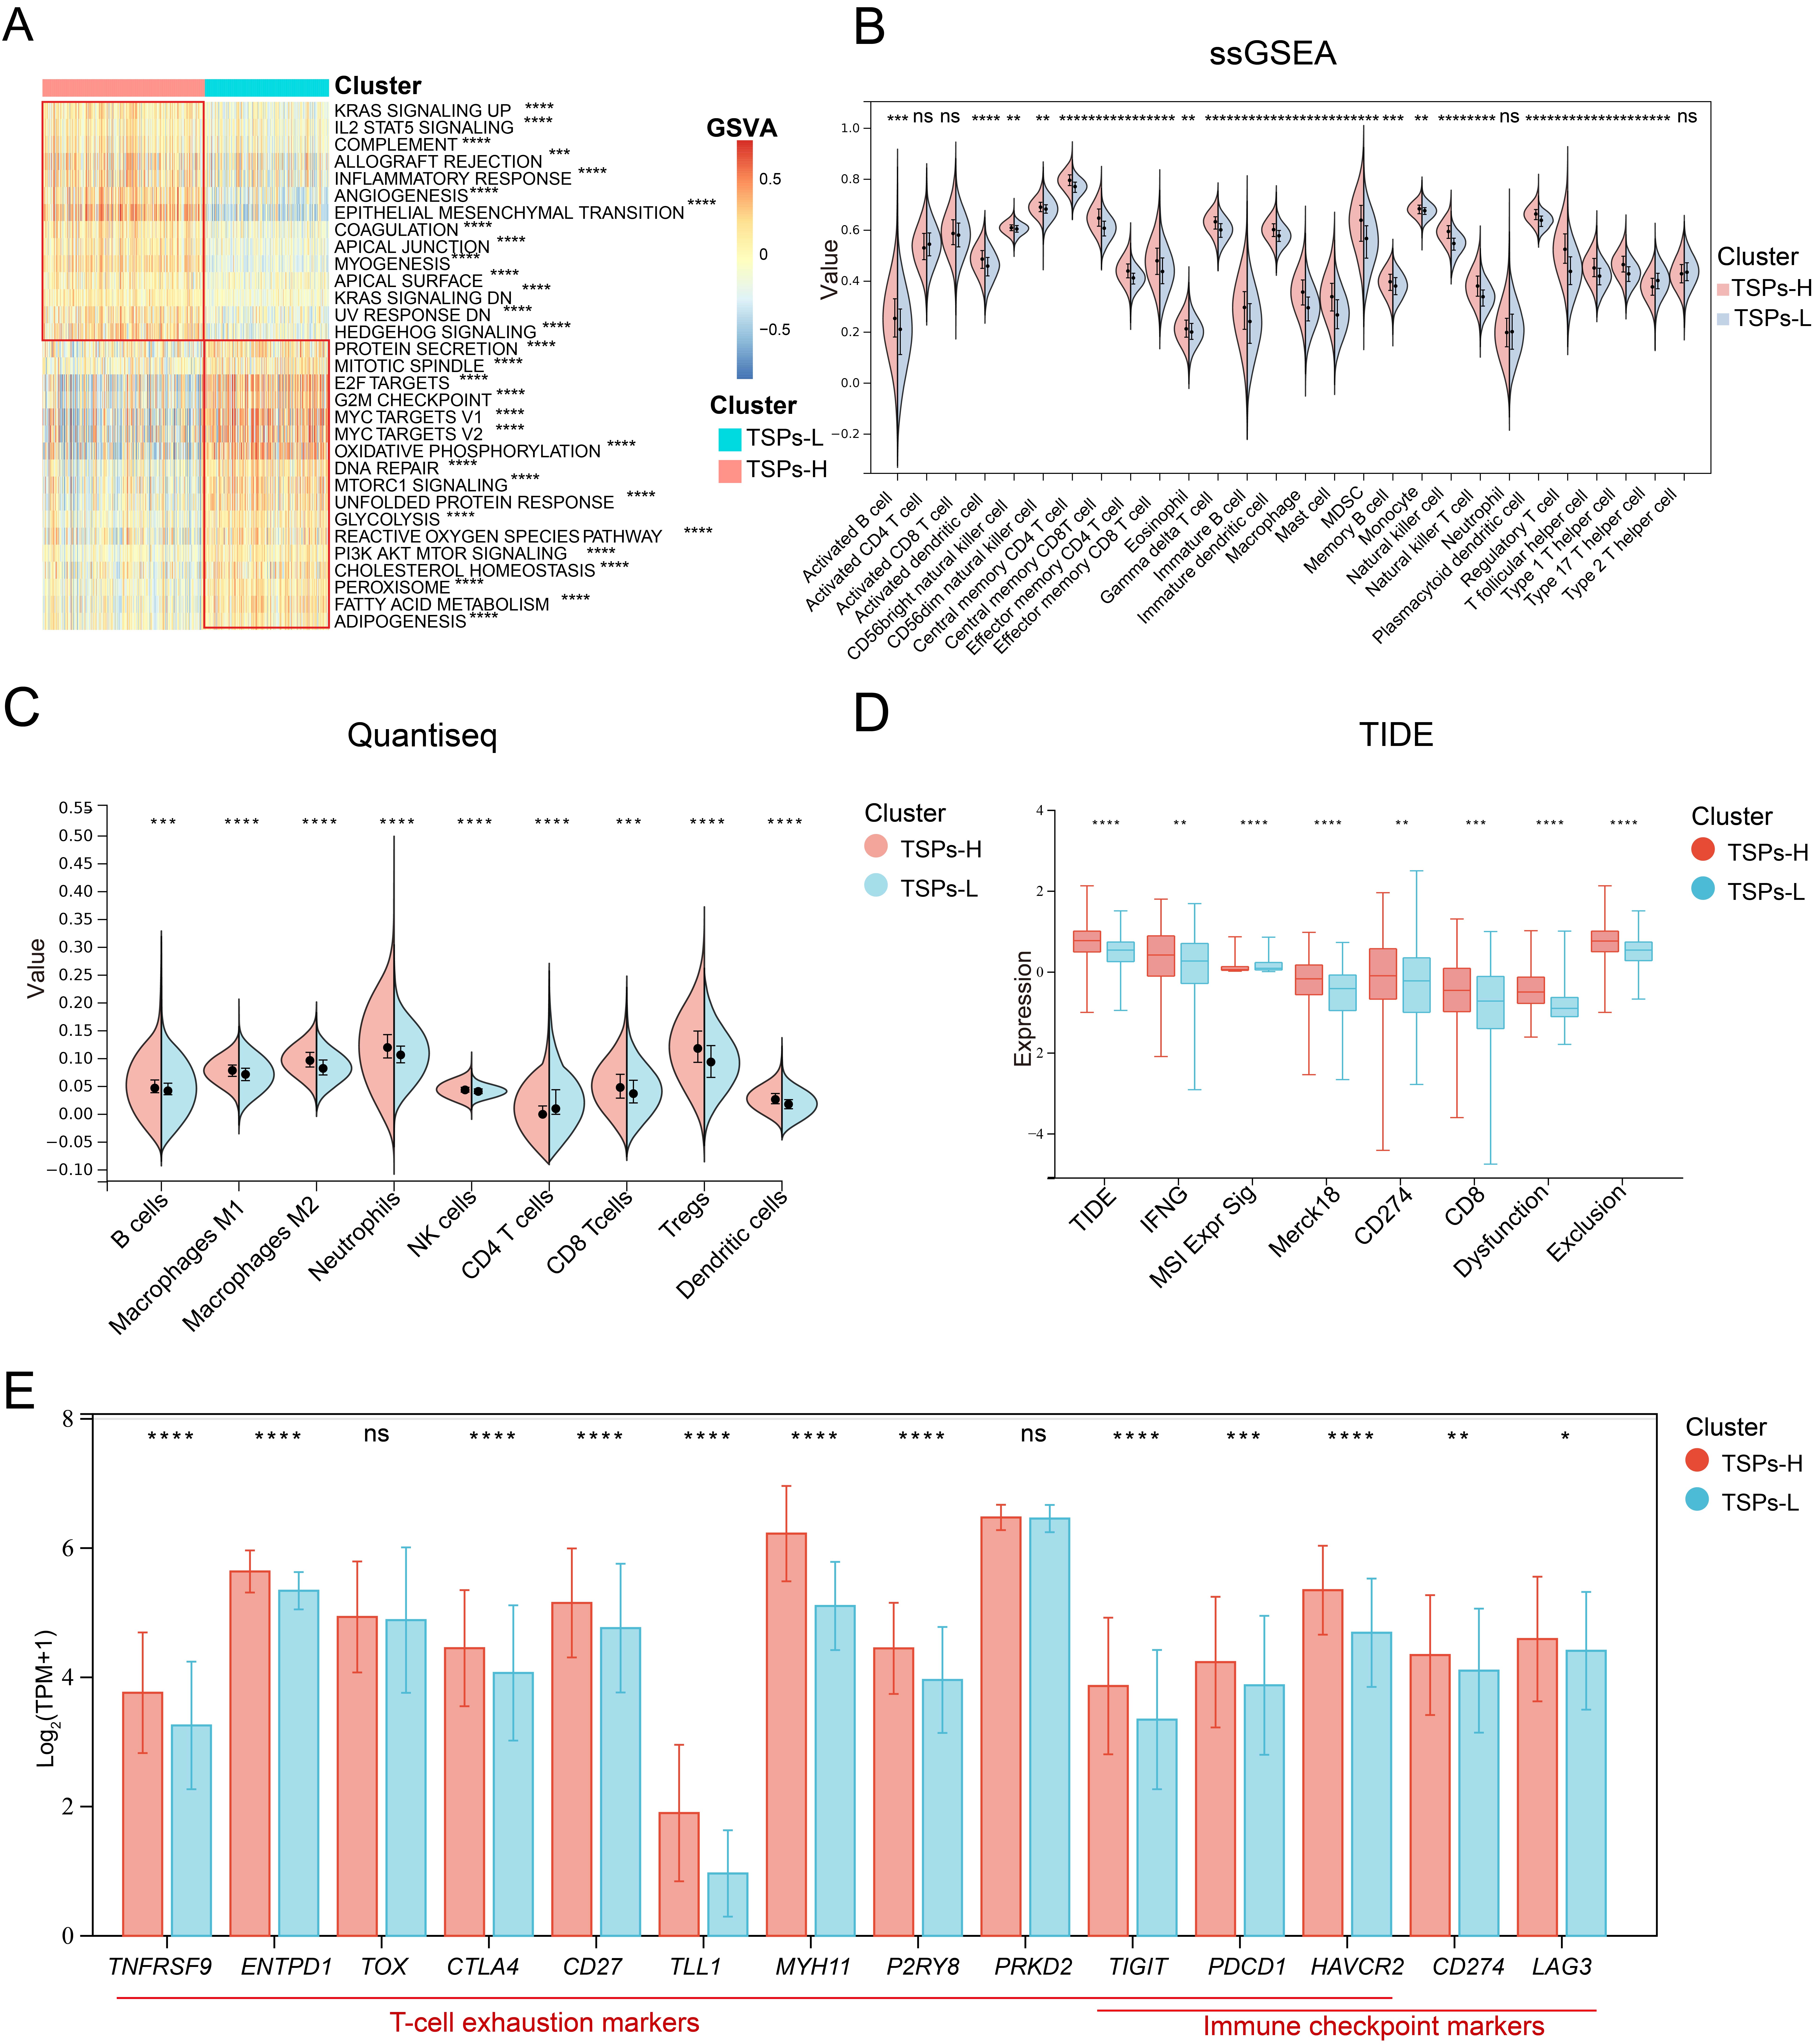
Fig.4 Differences in tumor microenvironment between two clusters (TSPs-H and TSPs-L).
(A) Differential score of hallmark pathways assessed by GSVA (***p < 0.001,****p < 0.0001). (B&C) Variations in tumor-infiltrating cells between clusters calculated using ssGSEA and quantiseq. (D) Estimation of immunological escape by TIDE for two clusters. Merck18, a T-cell-inflamed signature from literature (Ayers M,2017). (E) Gene expression levels of T-cell exhaustion and immune checkpoint markers between clusters. Bar heights represent mean values, and error lines depict the range of data fluctuations (*, p < 0.05;**, p < 0.01; ***, p < 0.001; ****, p < 0.0001).

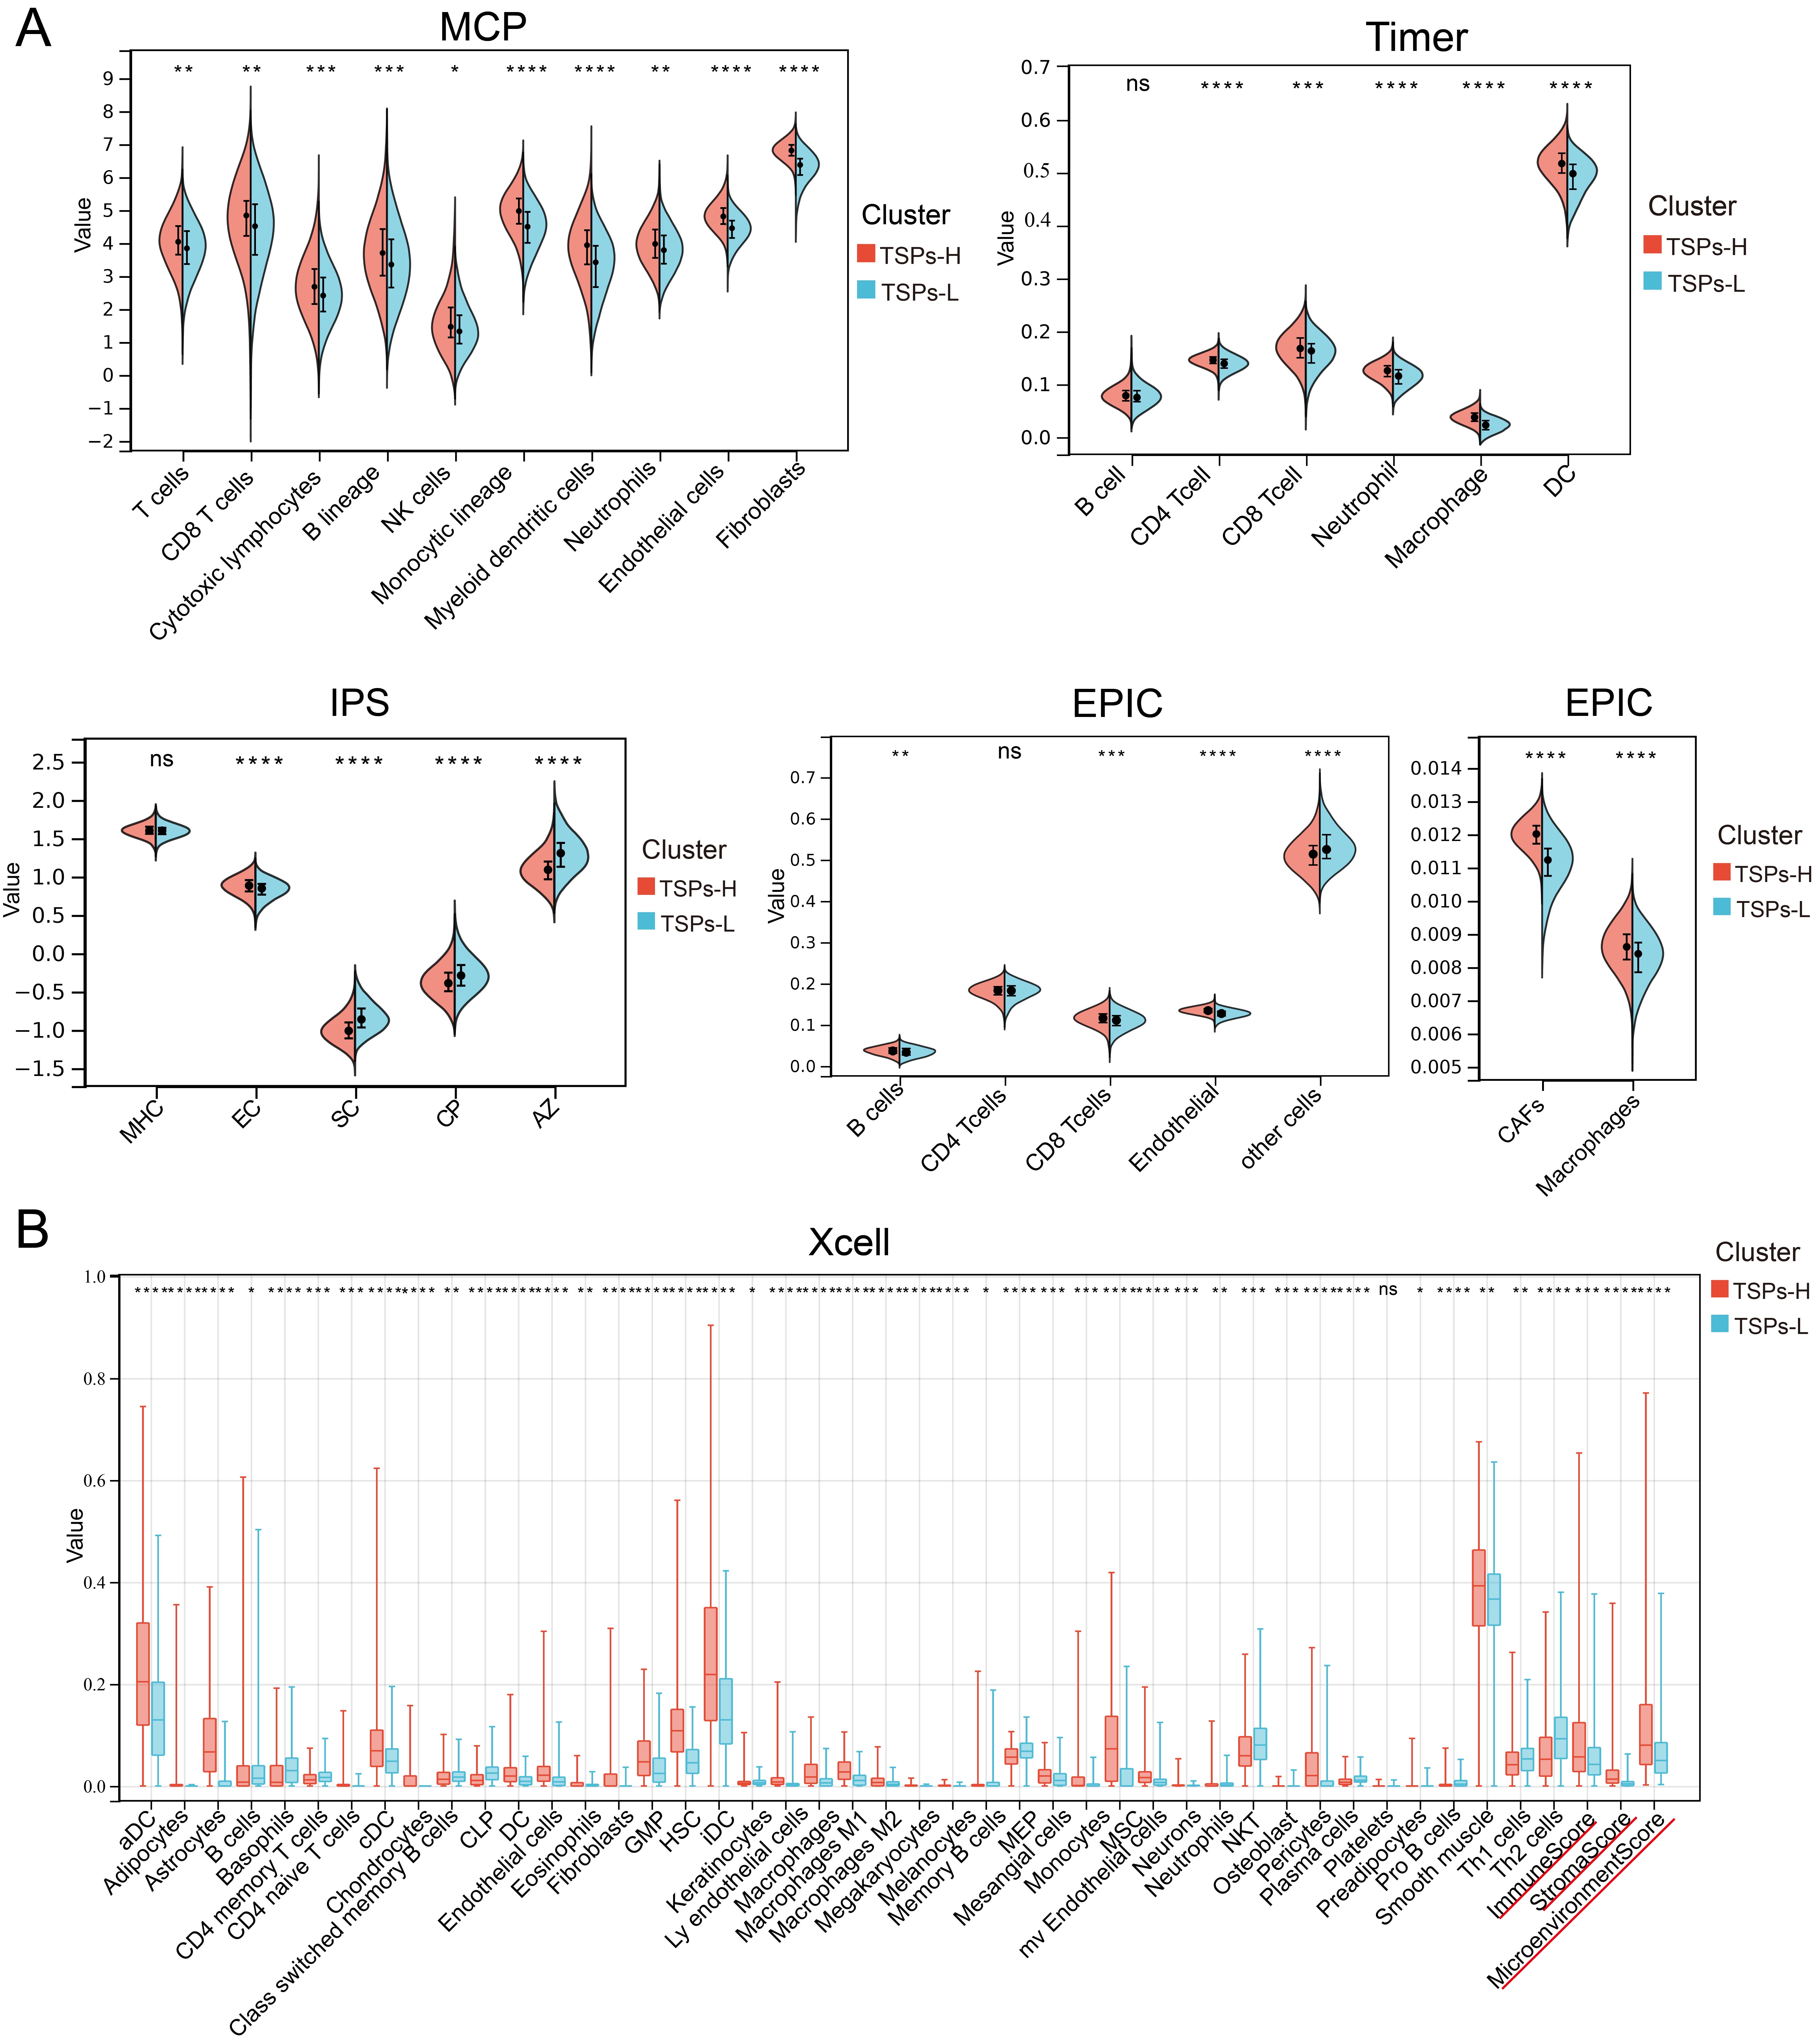
Fig. S4 Differences in tumor microenvironment between two clusters (TSPs-H and TSPs-L).
(A & B) Assessment of infiltrating cell component by MCP, Timer, IPS, EPIC and Xcell.
